Marginalia, Side Effects & Loose Threads
Where the work goes
An inspection of the software factory’s commit history.
Twenty-six thousand commits sounds impressive until you ask what is in them. A feature, a repair, a generated report and a note saying where an agent should resume can each add one to the counter. There is no exchange rate between them.
The galaxy on this site shows the shape of the work. I wanted a closer look at its composition. What I actually want to know is whether the factory is producing useful results with less of my attention. Git records activity in detail; connecting that activity to useful outcomes and my time is the harder part.
This inspection covers 25,940 non-merge commits across eight repositories, counted at pinned revisions on 21 October 2026. Another 182 merge commits are excluded so that joining branches does not add another event to this count of changes. The interesting part is what happens when that large total is taken apart.
The homepage galaxy’s 19 October snapshot covers 14 projects and all branches; this 21 October recount covers eight repositories and excludes merges, so the totals are not directly comparable.
Eight repositories, different kinds of work
BotSwarm is the largest part: 20,572 commits, 79% of the total. It is the persistent research fleet. Conclave, Control Tower and Tower Kit are part of the machinery used to coordinate, observe and constrain the coding work around it. They account for another 4,069 commits between them. The remaining repositories cover publishing, voice experiments and trading work.
Those are different activities with different histories. BotSwarm’s record starts in February; Control Tower’s starts in September. A publishing repository can produce something useful without changing a file that this analysis recognises as application code. A small voice experiment can matter to the way I work without adding much to the total.
That is why I would not rank these projects by their counts. Conclave Voice contributes six commits of my own; its inherited fork history is excluded. This site contributes forty. Neither number tells you whether the experiment was worthwhile or whether a visitor understood the homepage.
When changes accumulated
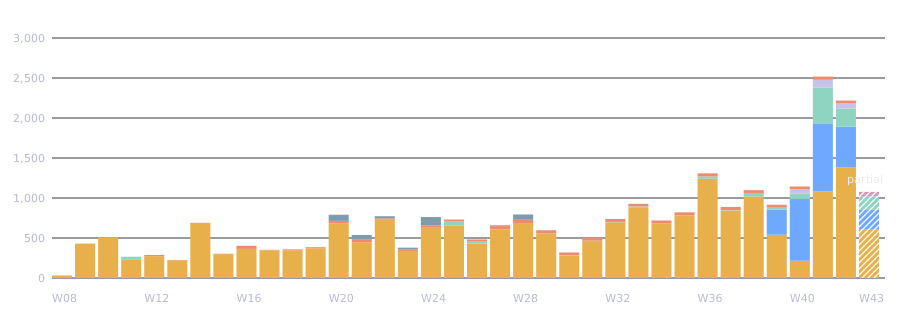
Weekly chart: exact counts in a table
| ISO week | BotSwarm | Control Tower | Conclave | Tower Kit | Phronopolis | Trading | Other | Total |
|---|---|---|---|---|---|---|---|---|
| 2026-W08 | 32 | 0 | 0 | 0 | 0 | 0 | 0 | 32 |
| 2026-W09 | 430 | 0 | 0 | 0 | 0 | 0 | 0 | 430 |
| 2026-W10 | 509 | 0 | 0 | 0 | 0 | 0 | 0 | 509 |
| 2026-W11 | 227 | 0 | 39 | 0 | 0 | 0 | 0 | 266 |
| 2026-W12 | 273 | 0 | 0 | 0 | 15 | 0 | 0 | 288 |
| 2026-W13 | 219 | 0 | 0 | 0 | 6 | 0 | 0 | 225 |
| 2026-W14 | 688 | 0 | 0 | 0 | 2 | 0 | 0 | 690 |
| 2026-W15 | 299 | 0 | 0 | 0 | 4 | 0 | 0 | 303 |
| 2026-W16 | 364 | 0 | 0 | 0 | 39 | 0 | 0 | 403 |
| 2026-W17 | 345 | 0 | 0 | 0 | 7 | 0 | 0 | 352 |
| 2026-W18 | 346 | 0 | 0 | 0 | 12 | 0 | 0 | 358 |
| 2026-W19 | 371 | 0 | 0 | 0 | 14 | 0 | 0 | 385 |
| 2026-W20 | 683 | 0 | 0 | 0 | 31 | 73 | 5 | 792 |
| 2026-W21 | 447 | 0 | 0 | 0 | 32 | 59 | 0 | 538 |
| 2026-W22 | 729 | 0 | 0 | 0 | 17 | 26 | 0 | 772 |
| 2026-W23 | 338 | 0 | 0 | 0 | 21 | 20 | 0 | 379 |
| 2026-W24 | 628 | 0 | 0 | 0 | 31 | 103 | 0 | 762 |
| 2026-W25 | 657 | 0 | 48 | 0 | 26 | 0 | 0 | 731 |
| 2026-W26 | 431 | 0 | 24 | 0 | 27 | 0 | 0 | 482 |
| 2026-W27 | 608 | 0 | 0 | 0 | 41 | 9 | 0 | 658 |
| 2026-W28 | 687 | 0 | 0 | 0 | 41 | 66 | 0 | 794 |
| 2026-W29 | 557 | 0 | 0 | 0 | 40 | 0 | 0 | 597 |
| 2026-W30 | 278 | 0 | 7 | 0 | 34 | 0 | 0 | 319 |
| 2026-W31 | 462 | 0 | 4 | 0 | 38 | 0 | 0 | 504 |
| 2026-W32 | 697 | 0 | 4 | 0 | 37 | 0 | 0 | 738 |
| 2026-W33 | 877 | 0 | 17 | 0 | 32 | 1 | 0 | 927 |
| 2026-W34 | 679 | 0 | 2 | 0 | 38 | 0 | 0 | 719 |
| 2026-W35 | 776 | 0 | 5 | 0 | 39 | 1 | 0 | 821 |
| 2026-W36 | 1,240 | 0 | 30 | 0 | 38 | 0 | 0 | 1,308 |
| 2026-W37 | 843 | 0 | 6 | 0 | 39 | 0 | 0 | 888 |
| 2026-W38 | 1,020 | 0 | 43 | 0 | 35 | 0 | 0 | 1,098 |
| 2026-W39 | 541 | 314 | 24 | 0 | 33 | 0 | 4 | 916 |
| 2026-W40 | 216 | 773 | 66 | 54 | 34 | 0 | 1 | 1,144 |
| 2026-W41 | 1,084 | 849 | 447 | 98 | 39 | 0 | 1 | 2,518 |
| 2026-W42 | 1,385 | 507 | 227 | 63 | 36 | 0 | 0 | 2,218 |
| 2026-W43 | 606 | 251 | 152 | 15 | 17 | 0 | 35 | 1,076 |
BotSwarm supplies most of the volume across the period, but the mix changes sharply. Conclave, Control Tower and Tower Kit together account for 893 of week 40’s 1,144 commits (78%), and 1,394 of week 41’s 2,518 (55%). Those weeks put much more of the recorded work into coordination tooling. Trading’s recorded activity is mostly finished by week 28, with one further commit in each of weeks 33 and 35. I still have to inspect the results to understand what that activity accomplished.
Most of the state-file bucket is in BotSwarm
In BotSwarm, 7,602 commits, about 37% by commit count, match the analysis’s bookkeeping and state-file rules. Across all eight repositories, the corresponding figure is 8,032, about 31%. Here is the full split, using the same rules throughout:
| Category | Commits | Share of commits |
|---|---|---|
| Bookkeeping / state rules | 8,032 | 31.0% |
| Maintenance-labelled | 6,878 | 26.5% |
| Feature-labelled, touches code | 3,815 | 14.7% |
| Documentation-labelled | 2,948 | 11.4% |
| Everything else | 4,267 | 16.4% |
BotSwarm contributes 94.6% of this bucket. In Conclave, Control Tower and Tower Kit combined, only 410 of 4,069 commits, about 10%, match these rules. The large combined share therefore cannot be read as the cost of the coordination tools. Most of it sits in the research repository, where state files can contain the product itself. The rules recognise data, logs, task and handoff records, other state-like files, and certain commit prefixes.
An illustrative example: a session stops partway through a change and writes down what passed, what remains open and the exact next action. Its successor reads that record and resumes. Git can count the continuity record as another change alongside the implementation. This example describes the mechanism; it is not a measured handoff from the dataset.
Some of this category is continuity machinery; some is research product written into state files; some may be unused inventory. The rules do not separate them. This changes where I would look first: at what BotSwarm’s state records contain and how they are used, before interpreting their count as coordination overhead.
The remaining buckets are also descriptions of the record: maintenance-labelled changes, feature-labelled changes touching recognised code, documentation-labelled changes and everything else. They follow rules in a fixed order. A maintenance prefix wins before a feature or documentation classification is considered; state-only changes are checked first.
Control Tower’s largest bucket is “everything else”: 1,079 commits, about 40%. The rules leave that much of its purpose unclassified. These labels select changes for inspection; they do not establish what was delivered.
The size of a change
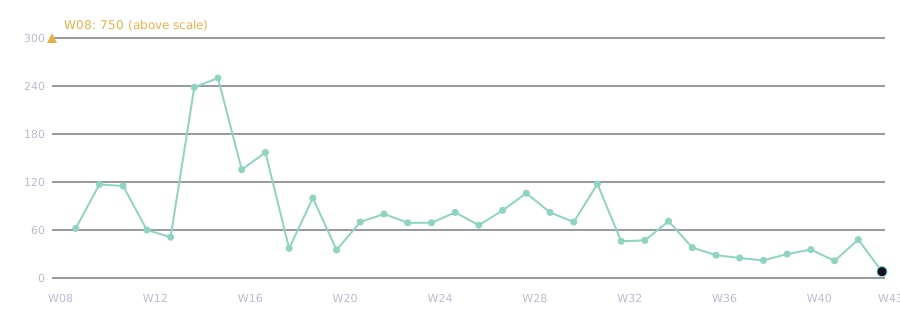
Median chart: exact values in a table
| ISO week | Median changed lines |
|---|---|
| 2026-W08 | 750 |
| 2026-W09 | 62 |
| 2026-W10 | 117 |
| 2026-W11 | 115 |
| 2026-W12 | 60 |
| 2026-W13 | 51 |
| 2026-W14 | 238.5 |
| 2026-W15 | 250 |
| 2026-W16 | 135.5 |
| 2026-W17 | 157 |
| 2026-W18 | 37 |
| 2026-W19 | 100 |
| 2026-W20 | 35 |
| 2026-W21 | 70 |
| 2026-W22 | 80 |
| 2026-W23 | 69 |
| 2026-W24 | 69 |
| 2026-W25 | 82 |
| 2026-W26 | 66 |
| 2026-W27 | 84.5 |
| 2026-W28 | 106 |
| 2026-W29 | 82 |
| 2026-W30 | 70 |
| 2026-W31 | 117.5 |
| 2026-W32 | 46 |
| 2026-W33 | 47 |
| 2026-W34 | 71 |
| 2026-W35 | 38 |
| 2026-W36 | 28.5 |
| 2026-W37 | 25 |
| 2026-W38 | 22 |
| 2026-W39 | 30 |
| 2026-W40 | 35.5 |
| 2026-W41 | 21.5 |
| 2026-W42 | 48 |
| 2026-W43 | 8 |
Here, changed lines means insertions plus deletions. Weekly medians are often around 60–120 lines through week 31, with a visible 135–250-line bump in weeks 14–17; ten of the eleven complete weeks from 32 through 42 are between 20 and 50. There is a sustained shift toward smaller changes, with exceptions. The opening week’s 750-line median is marked above the chart’s scale so it does not flatten the rest.
Better decomposition, cleanup, generated-file churn and changes in how agents commit can all affect the pattern. As a repository matures, removal can become a larger part of the work too.
Across the full record, the median is 62 changed lines and the mean is 588. Large imports, generated material and data changes pull the mean away from the typical edit: the fifty largest commits account for 44% of all changed lines.
This is one reason LOC is a meaningless progress score. You can increase it by importing a dataset, decrease it by removing a bad abstraction, or churn it by regenerating output. Splitting a change into smaller commits also makes the commit counter climb. Whether that makes my review easier requires a different measurement.
What follows a feature?
The analysis asks a narrower question about repairs. Take a commit labelled as a feature and look for a fix-labelled commit touching one of the same eligible code files in the next seven days. Require a full week of repository history on both sides. For BotSwarm, 1,682 of 2,919 eligible feature-labelled commits meet the follow-up test: 57.6%.
I also ran the follow-up test after non-feature code commits. BotSwarm’s rate there is 50.5%, a 7.2 percentage-point gap from the feature group. The corresponding gaps are 13.6 points in Conclave and 35.9 in Control Tower. These are descriptive associations between groups that can involve different files and periods.
| Repository | Fix after feature | Fix after non-feature | Gap |
|---|---|---|---|
| BotSwarm | 57.6% (2,919) | 50.5% (4,997) | 7.2 pp |
| Conclave | 67.8% (146) | 54.2% (415) | 13.6 pp |
| Control Tower | 89.3% (122) | 53.5% (645) | 35.9 pp |
A paired two-week block bootstrap gives a 95% percentile range of −2.2 to 15.1 points for BotSwarm’s overall 7.2-point gap. It includes zero. This is a sensitivity to how weeks are resampled, not a causal interval or a correction for file age.
A narrower comparison finds 1,070 BotSwarm pairs sharing an eligible file and matched on timing, file activity and number of files: 88.0% of features and 74.5% of comparison changes have a later fix, a 13.6-point gap calculated from the underlying counts. These high rates show how active the selected subset is; they do not isolate the effect of a feature or its label. The matching rules and activity-band comparisons are in Methods.
The before/after comparison also differs by group. Non-features are almost flat, at 50.4% before and 50.5% after; features move from 38.5% to 57.6%. That weakens a simple explanation in which rising activity lifts every after-window alike. File age and staged follow-ups still matter.
Restrict BotSwarm to features whose eligible paths are all at least seven days old, and the before/after swing disappears: 63.5% before, 62.6% after, over 422 features. Their follow-up rate remains above the 52.7% for 1,476 older-path non-feature changes, a 9.8-point gap. Features adding an eligible path have lower follow-up rates: 48.5% over 1,667 features, versus 40.3% for 2,079 non-features adding paths. That group can also touch older paths. The age split and the remaining young/mixed-path changes are shown in Methods.
The feature-versus-non-feature after-gaps remain positive in all three known-age BotSwarm groups: 8.3 points for changes adding a path, 10.1 for young/mixed paths, and 9.8 for exclusively older paths. This grouping does not remove the association.
The events are clustered. One fix is associated with as many as 62 BotSwarm feature commits. A file can hold unrelated behaviours, and overlapping windows can count the same repair repeatedly. The sample size does not give us thousands of independent observations.
Control Tower’s recorded history covers thirty calendar dates, from 22 September through 21 October. Even among changes adding an eligible path, 97 of 104 features (93.3%) have a later fix, against 73 of 205 non-features (35.6%). That 57.7-point gap remains within this broad age group. Only two features touch exclusively older paths, so established code remains unassessed. Staged work and commit-label conventions are two explanations the counts cannot rule out.
To interpret the association, I would need to read examples alongside their acceptance checks and issue records. Regressions, staged follow-ups and unrelated improvements sharing a file can all produce a match.
The missing denominator is my attention
The measure I most want is human minutes per verified, useful change. The factory could produce fewer commits and become much more useful if the result took less reconstruction, less correction and less checking from me. It could produce twice as many and leave me with a larger queue to inspect.
Git records neither side of that equation adequately. It does not record how long I spent recovering context, deciding between approaches, reviewing a result or discovering that a supposedly finished task still needed work. Nor does a merged change establish that its intended behaviour worked and stayed useful.
To measure that, I would need to connect a task’s acceptance condition, its observed result, subsequent reopening and my time spent on it. Complexity and severity would matter too. A typo and a coordination failure should not each count as one interchangeable success. That is a description of the evidence needed, not a scorecard this analysis has already filled in.
The next inspection has three concrete questions: which handoff records actually help the next session resume; what kinds of work the post-feature fixes contain; and whether smaller commits make my review quicker. Answering those would tell me more about operating this factory than another milestone on the commit counter.
Scope, exact counts and methods
| Repository | Commits |
|---|---|
| BotSwarm | 20,572 |
| Control Tower | 2,694 |
| Conclave | 1,145 |
| Tower Kit | 230 |
| Phronopolis | 895 |
| Conclave Voice | 6 |
| This site | 40 |
| Trading experiments | 358 |
The census reads eight local Git histories at pinned revisions, collected on 21 October at 17:49 UTC, excludes merges, and groups activity by the author date’s ISO week using its recorded offset. It is a selection of repositories, not a census of every project in the galaxy. Conclave Voice includes only commits matching the operator author identities used by the collection script. The Trading experiments row exposes aggregate development activity, not positions, returns or strategy details.
Composition by repository
| Repository | Bookkeeping / state rules | Maintenance-labelled | Feature-labelled, touches code | Documentation-labelled | Everything else | Total |
|---|---|---|---|---|---|---|
| BotSwarm | 7,602 | 5,672 | 3,404 | 2,243 | 1,651 | 20,572 |
| Control Tower | 231 | 731 | 209 | 444 | 1,079 | 2,694 |
| Conclave | 169 | 315 | 162 | 218 | 281 | 1,145 |
| Tower Kit | 10 | 136 | 40 | 42 | 2 | 230 |
| Phronopolis | 0 | 22 | 0 | 1 | 872 | 895 |
| Conclave Voice | 0 | 2 | 0 | 0 | 4 | 6 |
| This site | 1 | 0 | 0 | 0 | 39 | 40 |
| Trading | 19 | 0 | 0 | 0 | 339 | 358 |
Line-change statistics exclude root commits and sum numeric Git insertions and deletions; binary changes do not add lines. Generated material and data remain included. The composition rules retain at most 200 file entries per commit, affecting path classifications rather than numeric line totals. Checking the full file lists changed five classifications, all in BotSwarm, across the 25,940-commit census: a small observed effect on composition, without establishing that the limit has no effect on repair eligibility. Weekly plots use the ordinary median; the full-record size summary uses a nearest-rank percentile.
The repair calculation uses feature-labelled changes touching eligible Python, TypeScript, JavaScript or shell files. It excludes files touched by more than 100 non-merge commits in that repository and anchors within seven days of either end of its recorded history. A match is any fix-labelled change to at least one eligible shared file; non-feature comparisons use the same eligibility rules.
| Repository | Features | Before | After | Non-features | Before | After |
|---|---|---|---|---|---|---|
| BotSwarm | 2,919 | 38.5% | 57.6% | 4,997 | 50.4% | 50.5% |
| Conclave | 146 | 51.4% | 67.8% | 415 | 56.9% | 54.2% |
| Control Tower | 122 | 37.7% | 89.3% | 645 | 57.8% | 53.5% |
BotSwarm comparison by file activity
| Maximum eligible-file touches | Features | Fix after | Non-features | Fix after | Gap |
|---|---|---|---|---|---|
| 1-10 | 1,264 | 26.7% | 2,100 | 19.1% | 7.5 pp |
| 11-25 | 574 | 71.6% | 992 | 60.0% | 11.6 pp |
| 26-50 | 511 | 80.0% | 943 | 76.0% | 4.0 pp |
| 51-100 | 570 | 92.1% | 962 | 84.0% | 8.1 pp |
The matched check uses the nearest unused non-feature anchor within seven days, sharing at least one eligible file, with the same maximum file-touch band (1–10, 11–25, 26–50 or 51–100 commits) and eligible-file-count band (one, two to five, or six-plus). BotSwarm’s feature follow-up rate also exceeds the non-feature rate in each of the four activity bands. Matching does not remove overlapping events, commit-label conventions or differences in intent.
| Repository | Path-age group | Features | Before | After | Non-features | Before | After | After gap |
|---|---|---|---|---|---|---|---|---|
| BotSwarm | Adds a path (may also touch old paths) | 1,667 | 22.8% | 48.5% | 2,079 | 35.3% | 40.3% | 8.3 pp |
| BotSwarm | Young or mixed paths, no addition | 830 | 57.5% | 73.4% | 1,427 | 65.4% | 63.3% | 10.1 pp |
| BotSwarm | All eligible paths at least seven days old | 422 | 63.5% | 62.6% | 1,476 | 57.2% | 52.7% | 9.8 pp |
| BotSwarm | Unknown path age | 0 | n/a | n/a | 15 | 33.3% | 26.7% | n/a |
| Conclave | Adds a path (may also touch old paths) | 68 | 48.5% | 72.1% | 121 | 39.7% | 51.2% | 20.8 pp |
| Conclave | Young or mixed paths, no addition | 55 | 58.2% | 65.5% | 201 | 64.7% | 55.7% | 9.7 pp |
| Conclave | All eligible paths at least seven days old | 23 | 43.5% | 60.9% | 93 | 62.4% | 54.8% | 6.0 pp |
| Control Tower | Adds a path (may also touch old paths) | 104 | 34.6% | 93.3% | 205 | 32.7% | 35.6% | 57.7 pp |
| Control Tower | Young or mixed paths, no addition | 16 | 56.2% | 68.8% | 362 | 68.5% | 64.4% | 4.4 pp |
| Control Tower | All eligible paths at least seven days old | 2 | 50.0% | 50.0% | 78 | 74.4% | 50.0% | 0.0 pp |
Path age uses dated Git additions across the pinned history. A change adding any eligible path is in the first group, even if it also touches older paths. Otherwise, every eligible path must have its most recent recorded addition at least seven days earlier to qualify as established. The other groups contain younger/mixed-age paths or unknown addition dates. Renames are treated as new paths; this measures recorded path age, not the age of the underlying logic.
The bootstrap resamples both groups together in adjacent two-week blocks of anchor-week counts, with 10,000 draws, seed 20261021, and percentile endpoints. It preserves some local dependence, not all shared-file dependence. The 34-week series changes composition over time; block choice and the moving-block method’s endpoint underweighting limit interpretation. The interval is exploratory and does not establish an excess defect rate.
Only aggregate counts are shown. The claims apply to the dated snapshot above.